* perfctr questions
@ 2004-07-01 22:04 bert hubert
  2004-07-01 22:19 ` Bryan O'Sullivan
  0 siblings, 1 reply; 6+ messages in thread
From: bert hubert @ 2004-07-01 22:04 UTC (permalink / raw)
  To: Mikael.Pettersson; +Cc: linux-kernel

Mikael,

I'm trying to test your performance counters stuff, but I can't get it to do
anything remotely useful! Probably just me.

I have a very hard time understanding things like:

 *      perfex -e 0x00039000/0x04000204@0x8000000C some_program
 *
 *      Explanation: Program IQ_CCCR0 with required flags, ESCR select 4
 *      (== CRU_ESCR0), and Enable. Program CRU_ESCR0 with event 2
 *      (instr_retired), NBOGUSNTAG, CPL>0. Map this event to IQ_COUNTER0
 *      (0xC) with fast RDPMC enabled.

I'd love to author a small perfctr howto for people like me who just want to
know if their code is thrashing the cache.

Do you have a pointer to tools that do this, or, how to calculate these
0x00039000 numbers for perfex? I can't find anything relevant. The best
information I found is in the 'hardmeter' sources.

I tried one very basic thing, perfex -e 0x00410005 ./null which I hoped
would measure unaligned memory accesses, but I can't get this counter raised
from 0. null.c:

int main(int argc, char **argv)
{
        char room[12];
        int i, n;

        for(n=0;n<1000000;++n) {
                i=*((int*)(room+n%4));
        }

        printf("%d\n", i);
}

I'm on a Pentium M, 2.6.7-mm5. Not even sure if an Pentium M will measure
cache misses though.

Thanks

--
http://www.PowerDNS.com      Open source, database driven DNS Software
http://lartc.org           Linux Advanced Routing & Traffic Control HOWTO

^ permalink raw reply	[flat|nested] 6+ messages in thread
* Re: perfctr questions
2004-07-01 22:04 perfctr questions bert hubert
@ 2004-07-01 22:19 ` Bryan O'Sullivan
2004-07-01 22:56 ` bert hubert
2004-07-01 23:26 ` bert hubert
0 siblings, 2 replies; 6+ messages in thread
From: Bryan O'Sullivan @ 2004-07-01 22:19 UTC (permalink / raw)
To: bert hubert; +Cc: Mikael.Pettersson, linux-kernel
[-- Attachment #1: Type: text/plain, Size: 1037 bytes --]
On Fri, 2004-07-02 at 00:04 +0200, bert hubert wrote:
> I'm trying to test your performance counters stuff, but I can't get it to do
> anything remotely useful! Probably just me.
No, it's just obscure.
You have three options for now. The first is to read the Intel or AMD
CPU performance counter docs, which I don't recommend, because that kind
of thing is never fun.
The second is to build a library called PAPI, which includes a command
called papiex that provides a less intimidating performance counter
interface. However, building PAPI with a not-quite-the-same version of
perfctr is a bit daunting, so I don't recommend that, either.
Your third option is to build a version of perfex that I've hacked on,
but not had time to finish up and submit to Mikael. I've attached it as
a tarball. This includes a man page that makes the usage less scary,
and it also accepts (gasp) textual arguments instead of hex strings.
I've tested it on P6, Pentium M and AMD64 chips.
<b
--
Bryan O'Sullivan
Software Tools
PathScale, Inc.
[-- Attachment #2: perfex.tar.bz2 --]
[-- Type: application/x-bzip-compressed-tar, Size: 10493 bytes --]
^ permalink raw reply [flat|nested] 6+ messages in thread
* Re: perfctr questions
  2004-07-01 22:19 ` Bryan O'Sullivan
@ 2004-07-01 22:56   ` bert hubert
  2004-07-01 23:26   ` bert hubert
  1 sibling, 0 replies; 6+ messages in thread
From: bert hubert @ 2004-07-01 22:56 UTC (permalink / raw)
  To: Bryan O'Sullivan; +Cc: Mikael.Pettersson, linux-kernel

Bryan,

Thanks for your quick reply!

On Thu, Jul 01, 2004 at 03:19:54PM -0700, Bryan O'Sullivan wrote:

> called papiex that provides a less intimidating performance counter
> interface.  However, building PAPI with a not-quite-the-same version of
> perfctr is a bit daunting, so I don't recommend that, either.

pepiex doesn't build for me, I was actually trying that already. It tries to
take over pthreads, which I think breaks. PAPI does look nice though.

> Your third option is to build a version of perfex that I've hacked on,
> but not had time to finish up and submit to Mikael.  I've attached it as
> a tarball.  This includes a man page that makes the usage less scary,
> and it also accepts (gasp) textual arguments instead of hex strings.
> I've tested it on P6, Pentium M and AMD64 chips.

Ah, cool - seems to have bitrotted somewhat, perfctr_*_event_* appear no
longer to exist in perfctr 2.7.3.

In any case, your manpage inspired some command lines that at least appear
to generate numbers, thanks.

But we're obviously not there yet.

--
http://www.PowerDNS.com      Open source, database driven DNS Software
http://lartc.org           Linux Advanced Routing & Traffic Control HOWTO

^ permalink raw reply	[flat|nested] 6+ messages in thread
* Re: perfctr questions
  2004-07-01 22:19 ` Bryan O'Sullivan
  2004-07-01 22:56   ` bert hubert
@ 2004-07-01 23:26   ` bert hubert
  1 sibling, 0 replies; 6+ messages in thread
From: bert hubert @ 2004-07-01 23:26 UTC (permalink / raw)
  To: Bryan O'Sullivan; +Cc: Mikael.Pettersson, linux-kernel, akpm

On Thu, Jul 01, 2004 at 03:19:54PM -0700, Bryan O'Sullivan wrote:

> > I'm trying to test your performance counters stuff, but I can't get it to do
> > anything remotely useful! Probably just me.

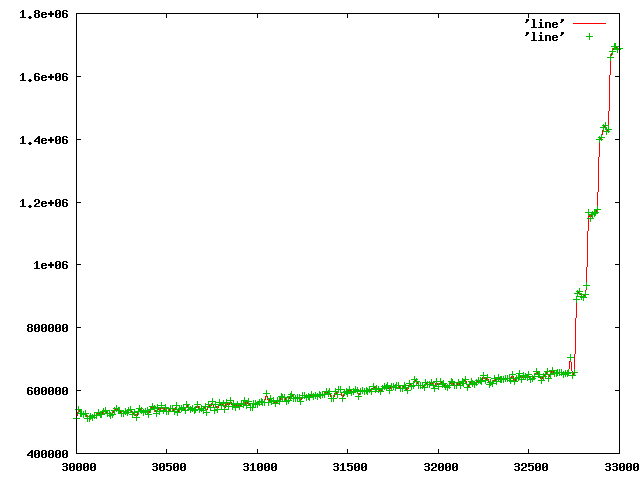
Ok, it is working. This is a plot of the number of L2 Address Strobes
counted while scanning a buffer of x bytes: http://ds9a.nl/tmp/strobes.png

>From dmesg:
CPU: L1 I cache: 32K, L1 D cache: 32K

Note the sharp rise at 32768 bytes!

int main(int argc, char **argv)
{
        char *memory;
        int len=atoi(argv[1]);
        memory=malloc(len);
        int n, count;
        for(count=0;count<10000;++count)
                for(n=1;n<len;++n) {
                        memory[n]++;
                }
}

Script:

for a in $(seq 30000 10 35000) ; do perfex -o log -e 0x00410021 ./null $a ;
echo -n "$a " ; tail -1 log | awk '{print $3}'; done > line

The '21' stands for P6_L2_ADS.

Cool stuff!

Regards,

bert

--
http://www.PowerDNS.com      Open source, database driven DNS Software
http://lartc.org           Linux Advanced Routing & Traffic Control HOWTO

^ permalink raw reply	[flat|nested] 6+ messages in thread
* Re: perfctr questions
@ 2004-07-02 10:21 Mikael Pettersson
  2004-07-02 11:04 ` bert hubert
  0 siblings, 1 reply; 6+ messages in thread
From: Mikael Pettersson @ 2004-07-02 10:21 UTC (permalink / raw)
  To: ahu; +Cc: linux-kernel

On Fri, 2 Jul 2004 00:04:48 +0200, bert hubert <ahu@ds9a.nl> wrote:
>I'm trying to test your performance counters stuff, but I can't get it to do
>anything remotely useful! Probably just me.
>
>I have a very hard time understanding things like:
>
> *      perfex -e 0x00039000/0x04000204@0x8000000C some_program
> *
> *      Explanation: Program IQ_CCCR0 with required flags, ESCR select 4
> *      (== CRU_ESCR0), and Enable. Program CRU_ESCR0 with event 2
> *      (instr_retired), NBOGUSNTAG, CPL>0. Map this event to IQ_COUNTER0
> *      (0xC) with fast RDPMC enabled.
>
>I'd love to author a small perfctr howto for people like me who just want to
>know if their code is thrashing the cache.
>
>Do you have a pointer to tools that do this, or, how to calculate these
>0x00039000 numbers for perfex? I can't find anything relevant. The best
>information I found is in the 'hardmeter' sources.

Unfortunately, the corresponding hardware both varies
quite a lot between processor families and manufacturers,
and in some cases (P4) is highly complex to begin with.

perfctr provides the low-level interface to these things,
and therefore you must be familiar with the hardware in
order to use it. So reading the Intel "IA32 Volume 3"
and AMD "kernel & bios" manuals is a prerequisite.

I rely on others to provide user-friendly tools and libraries.
For libraries, you should use PAPI. For tools, there are
a few, including Bryan's modifications to my (raw) perfex.

Should the kernel driver directly support some user-friendly
model of the counters? No it should not, for several reasons:
- The complexity and variability of the hardware means that
  any model would be inaccurate. You'd both lose a lot of
  functionality, and have a lot of functionality which isn't
  supportable on any given processor. User-space stuff that
  tries this approach tends to also include a direct-access
  backdoor, which brings us back to the present situation.
- The implementation of such a model would be large and complex.
  It's better to do the complex stuff in user-space, allowing
  the kernel drivers to only validate control data and drive
  the hardware.
- The model is purely a user-convenience thing. The drivers
  don't need it.

>I tried one very basic thing, perfex -e 0x00410005 ./null which I hoped
>would measure unaligned memory accesses, but I can't get this counter raised
>from 0. null.c:
>
>int main(int argc, char **argv)
>{
>        char room[12];
>        int i, n;
>
>        for(n=0;n<1000000;++n) {
>                i=*((int*)(room+n%4));
>        }
>
>        printf("%d\n", i);
>}
>
>I'm on a Pentium M, 2.6.7-mm5. Not even sure if an Pentium M will measure
>cache misses though.

I get '2' on a Pentium-II. It may be that the event only
counts actual external memory references, in which case
the processor's internal caches will cancel most of them.

I've had similar questions before, where it turned out
that gcc had optimised away the code that was to be measured.
Synthetic benchmarks are tricky...

/Mikael

^ permalink raw reply	[flat|nested] 6+ messages in thread
* Re: perfctr questions
2004-07-02 10:21 Mikael Pettersson
@ 2004-07-02 11:04 ` bert hubert
0 siblings, 0 replies; 6+ messages in thread
From: bert hubert @ 2004-07-02 11:04 UTC (permalink / raw)
To: Mikael Pettersson; +Cc: linux-kernel
On Fri, Jul 02, 2004 at 12:21:11PM +0200, Mikael Pettersson wrote:
> Should the kernel driver directly support some user-friendly
> model of the counters? No it should not, for several reasons:
We are in violent agreement - however, I do find that for a product to be
properly evaluated and to receive testing coverage, it is vital that the
learning curve not be this steep.
Right now, PAPI does not build for perfctr 2.7.3 (at least for me), nor do
Bryan's modifications. Furthermore, I had to reverse engineer a lot of
details to get my own things working.
I also read the AMD documentation and it is worthless and spends all of
three pages on the performance counters.
The good news however is that things do appear to work. What I'll do is whip
up a very small bootstrapping document. I'm sure PAPI is fine but for
many/my purposes it is overkill, I'd like for people to be able to
understand enough of perfctrs so they can start using them.
Like this:
CacheMeter cm;
for(unsigned int n=0;n<iterations;++n) {
c=area[(n*64)%limit];
total+=c; // force gcc to actually look at it
}
cm.print();
Will do 100000000 reads over range of 10000000 bytes
Data cache accesses: 100109359
Data cache misses: 99977036
L2 hit, L1 miss: 26395
L2 miss, L1 miss: 1540114
Will do 100000000 reads over range of 1000 bytes
Data cache accesses: 100047618
Data cache misses: 8523
L2 hit, L1 miss: 0
L2 miss, L1 miss: 664
Code on htp://ds9a.nl/tmp/cmeter.cc - will only work on AMD and is in C++.
People with AMD knowledge are kindly invited to elaborate on the meaning of
'cache miss' v 'l2 and l2 miss' :-)
Mikael, thanks, this stuff is powerful and it will enable people to write
better code!
--
http://www.PowerDNS.com Open source, database driven DNS Software
http://lartc.org Linux Advanced Routing & Traffic Control HOWTO
^ permalink raw reply [flat|nested] 6+ messages in thread
end of thread, other threads:[~2004-07-02 11:10 UTC | newest]

Thread overview: 6+ messages (download: mbox.gz / follow: Atom feed)
-- links below jump to the message on this page --
2004-07-01 22:04 perfctr questions bert hubert
2004-07-01 22:19 ` Bryan O'Sullivan
2004-07-01 22:56   ` bert hubert
2004-07-01 23:26   ` bert hubert
2004-07-02 10:21 Mikael Pettersson
2004-07-02 11:04 ` bert hubert
This is a public inbox, see mirroring instructions
for how to clone and mirror all data and code used for this inbox
all inboxes | Powered by JetHome®